Homelab monitoring using Grafana and Prometheus

I have a homelab, mainly as a hobby but also as an environment for experimentation. It’s quite useful for self-hosting different services—not only because of the potential cost savings (although you do need to account for hardware costs and electricity) — but also because it allows you to develop skills that will be useful as a professional developer.
And the best part? You don’t have to invest a lot of money — I didn’t. I started my homelab with a Raspberry Pi 3B, and for about a year, that was all I needed. It was capable of running HomeAssistant and Mosquitto well enough. Eventually, as I brought more services into my homelab, I had to expand. And guess what? I got a Raspberry Pi 4. So now I have two hosts in my homelab, and the most important question I had to answer was which node should run each service and what kind of availability I wanted.
Docker was the solution I decided to go with because it allows me to easily describe services and their storage needs (using Docker Compose), and also because I can easily transfer services between hosts. Eventually, I even tried defining my homelab as a Docker Swarm cluster, although I recently decided to roll it back. But that’s a story for another post.
Recently, I expanded my homelab yet again, now with a… Raspberry Pi 5, as the RPi 4 was getting a little overloaded—not by CPU consumption, but because of memory. So having an extra node to balance that load was the best solution.
At this moment, it’s quite tricky for me to know what maintenance each node requires unless I manually SSH into each one to check from time to time, which is far from ideal. I’m talking about system updates, free space on the different attached hard drives, SMART alerts they may raise, and so on.
It’s not scalable, so I needed to start automating. The first step, which is what this post covers, was to create dashboards and bring visibility to the hosts and services I’m running in my homelab.
Dashboards
Let’s start by defining the software stack I’m going to set up:
- Grafana: to create nice dashboards
- Prometheus: to scrape raw data from remote services and hosts that will be presented in the dashboards
- prometheus-node-exporter: a service that will be running on each node, exposing operating system metrics (CPU, memory, disk free, etc.) to Prometheus
- cAdvisor: a service that runs as a Docker container on each node, exposing details about the containers that the node is hosting
- Docker: to run Dockerized services (all the described services except for prometheus-node-exporter, which runs natively on the host system)
This would be the way these components interact with each other:
  sequenceDiagram
  participant Grafana
  participant Prometheus
  participant prometheus-node-exporter
  participant cAdvisor
  participant docker

  par
    Note over prometheus-node-exporter, docker: These components run on remote hosts
    Prometheus ->> prometheus-node-exporter: Scrape node status
    Prometheus ->>+ cAdvisor: Scrape docker details
    cAdvisor ->>- docker: Introspect containers
  end
  Grafana ->> Prometheus: Display data
How-to run these services
Services supporting the dashboards
I chose the oldest Raspberry Pi that I had available (a Raspberry Pi 3B with 1GB RAM), flashed a fresh copy of Raspbian, and then installed Docker:
sudo apt install docker.io docker-compose
Next, I added my user to the Docker group:
sudo usermod -aG docker youruser
This sets the basis for running the rest of the services, starting with a Docker Compose file containing Grafana and Prometheus:
services:
  prometheus:
    image: prom/prometheus
    command:
      - '--config.file=/etc/prometheus/prometheus.yml'
    ports:
      - 9090:9090
    restart: unless-stopped
    volumes:
      - /homelab/volumes/monitoring_prometheus:/etc/prometheus
      - prometheus_data:/prometheus
  grafana:
    image: grafana/grafana
    ports:
      - 3000:3000
    restart: unless-stopped
    volumes:
      - /homelab/volumes/monitoring_grafana:/etc/grafana/provisioning/datasources
      - grafana_data:/var/lib/grafana
volumes:
  prometheus_data:
  grafana_data:
where ‘prometheus.yml’ contains:
global:
  scrape_interval: 15s
  scrape_timeout: 10s
  evaluation_interval: 15s
alerting:
  alertmanagers:
  - static_configs:
    - targets: []
    scheme: http
    timeout: 10s
    api_version: v1
scrape_configs:
- job_name: prometheus
  honor_timestamps: true
  metrics_path: /metrics
  scheme: http
  static_configs:
    - targets:
      - localhost:9090
- job_name: homelab_node_exporter
  static_configs:
    - targets:
      - homelab:9100
- job_name: homelab_docker_engines
  static_configs:
    - targets:
      - homelab:9323
- job_name: homelab_docker_containers
  static_configs:
    - targets:
      - homelab:3080
- job_name: external_app
  static_configs:
    - targets:
      - remote.server:3080
      - remote.server:3081
  basic_auth: # This is an example on how to scrape data from a remote host that is behind HTTP Basic Auth
    username: user # Replace this with a user of your choice!
    password: XYZ # Replace this with a clear text password of your choice!
(where homelab is the DNS name or IP of the host your scrapping the data)
and datasource.yml contains:
apiVersion: 1
datasources:
- name: Prometheus
  type: prometheus
  url: http://prometheus:9090
  isDefault: true
  access: proxy
  editable: true
With all these files in place, it’s now just a matter of creating the new containers with the following command (run it in the same directory where docker-compose.yml is located):
docker-compose up -d
If you access the Prometheus service URL now (replace ip with the IP address of the machine where you just set up Grafana and Prometheus):
http://ip:9090/targets
You should be able to see the list of configured targets, which should all be displayed as down. We’ve defined them in the configuration file, but they are not yet available to be scraped.
Services exposing data to be scraped
Now, on every host that we’d need to monitor, we will need to:
- For hosts that are NOT exposed to the internet, we can export docker metrics that will be read by Prometheus. To do that, edit
/etc/docker/daemon.json:
{
  "metrics-addr": "ip:9323"
}
and restart docker:
sudo systemctl restart docker.service
- Run
prometheus-node-exporter:
sudo apt install prometheus-node-exporter
This will install it as a new service and start it right away.
- Run a Docker container with cAdvisor to expose container details to Prometheus. I chose to use Docker Compose for this as well:
services:
  cadvisor:
    image: gcr.io/cadvisor/cadvisor:latest
    restart: unless-stopped
    volumes:
      - /:/rootfs:ro
      - /var/run:/var/run:ro
      - /sys:/sys:ro
      - /var/lib/docker/:/var/lib/docker:ro
      - /dev/disk/:/dev/disk:ro
    devices:
      - /dev/kmsg
    ports:
      - 3080:8080
(Note: if the host is publicly available on Internet, remove the ports section from the docker-compose.yml file above, there is an explanation below on how to secure this data)
And as we did before:
docker-compose up -d
If you reload the Prometheus service URL (that you’ve set up in the previous section), you should now see the configured targets as healthy.
We are now ready to start creating dashboards.
Creating the dashboards
-
Set up your admin account in Grafana: Begin by configuring your admin account for Grafana to manage access and settings.
-
Add Prometheus as a data source: You’ll need to add Prometheus as a data source in Grafana. Since Prometheus is running as part of the same Docker stack as Grafana, you can use
http://prometheus:9090as the URL.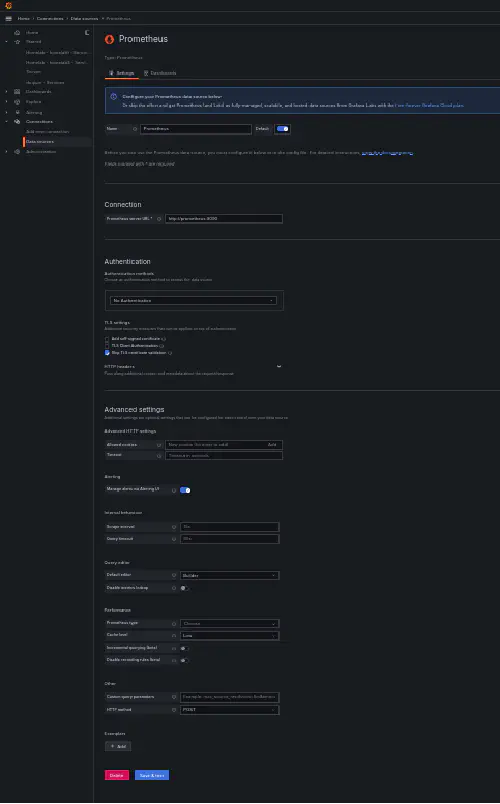
-
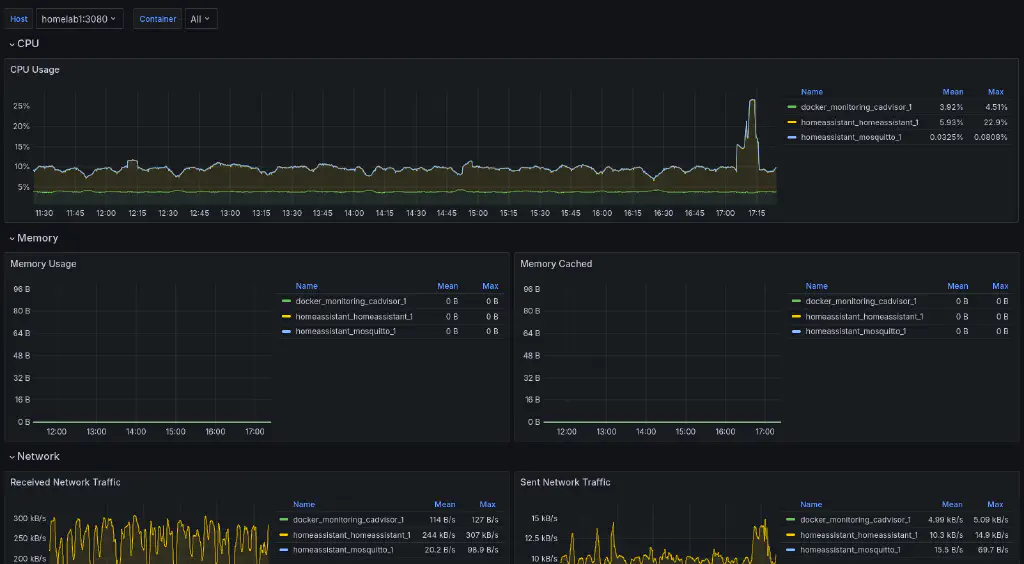
Import the cAdvisor exporter dashboard: Use the cAdvisor exporter dashboard (ID: 14282) to display node details. You can find it at this link.
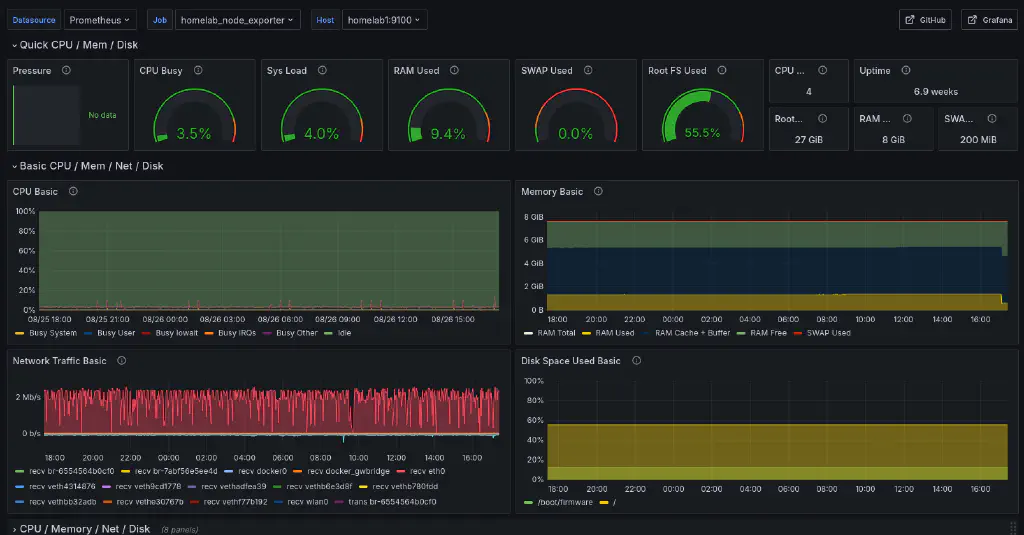
-
Import the Node Exporter Full dashboard: Use the Node Exporter Full dashboard (ID: 1860) to display Docker container details, using this link.
Securing access to the raw data
Up to this point, we haven’t focused on security because we’ve been monitoring hosts and services within our homelab, which isn’t directly accessible from the internet.
However, if we want to monitor an external service using our locally hosted Grafana instance, we need to implement security measures. The prometheus-node-exporter and cAdvisor could be exposing sensitive data that we don’t want to be publicly accessible.
These are the steps that you should follow to secure your data (using a reverse proxy applying HTTP Basic Auth):
Create a new Docker stack (docker-compose.yml) with the following content (Note: in this case, cAdvisor container is not directly exposing any port):
services:
  cadvisor:
    image: gcr.io/cadvisor/cadvisor:latest
    restart: unless-stopped
    volumes:
      - /:/rootfs:ro
      - /var/run:/var/run:ro
      - /sys:/sys:ro
      - /var/lib/docker/:/var/lib/docker:ro
      - /dev/disk/:/dev/disk:ro
    devices:
      - /dev/kmsg

  # https://github.com/dtan4/nginx-basic-auth-proxy
  nginx-cadvisor:
    #image: quay.io/dtan4/nginx-basic-auth-proxy:latest
    build:
      context: .
    ports:
      - 3080:80
      #- 8090:8090
    environment:
      - BASIC_AUTH_USERNAME=user # Replace this with the username of your choice
      - BASIC_AUTH_PASSWORD=XYZ # Replace this with a clear text password of your choice!
      - PROXY_PASS=http://cadvisor:8080

  nginx-node-exporter:
    #image: quay.io/dtan4/nginx-basic-auth-proxy:latest
    build:
      context: .
    ports:
      - 3081:80
      #- 8090:8090
    environment:
      - BASIC_AUTH_USERNAME=user # Replace this with the username of your choice
      - BASIC_AUTH_PASSWORD=XYZ # Replace this with a clear text password of your choice!
      - PROXY_PASS=http://172.17.0.1:9100
Additionally, create a Dockerfile in the same directory with the following content:
FROM nginx:1.11.9-alpine

# for htpasswd command
RUN apk add --no-cache --update \
      apache2-utils
RUN rm -f /etc/nginx/conf.d/*

ENV SERVER_NAME example.com
ENV PORT 80
ENV CLIENT_MAX_BODY_SIZE 1m
ENV PROXY_READ_TIMEOUT 60s
ENV WORKER_PROCESSES auto

COPY files/run.sh /
COPY files/nginx.conf.tmpl /

RUN ["chmod", "+x", "/run.sh"]

# use SIGQUIT for graceful shutdown
# c.f. http://nginx.org/en/docs/control.html
STOPSIGNAL SIGQUIT

ENTRYPOINT ["/run.sh"]
where files/run.sh contains:
#!/bin/sh

set -e

if [ -z $BASIC_AUTH_USERNAME ]; then
  echo >&2 "BASIC_AUTH_USERNAME must be set"
  exit 1
fi

if [ -z $BASIC_AUTH_PASSWORD ]; then
  echo >&2 "BASIC_AUTH_PASSWORD must be set"
  exit 1
fi

if [ -z $PROXY_PASS ]; then
  echo >&2 "PROXY_PASS must be set"
  exit 1
fi

htpasswd -bBc /etc/nginx/.htpasswd $BASIC_AUTH_USERNAME $BASIC_AUTH_PASSWORD
sed \
  -e "s/##CLIENT_MAX_BODY_SIZE##/$CLIENT_MAX_BODY_SIZE/g" \
  -e "s/##PROXY_READ_TIMEOUT##/$PROXY_READ_TIMEOUT/g" \
  -e "s/##WORKER_PROCESSES##/$WORKER_PROCESSES/g" \
  -e "s/##SERVER_NAME##/$SERVER_NAME/g" \
  -e "s/##PORT##/$PORT/g" \
  -e "s|##PROXY_PASS##|$PROXY_PASS|g" \
  nginx.conf.tmpl > /etc/nginx/nginx.conf

exec nginx -g "daemon off;"
and files/nginx.conf.tmpl:
user nginx;
worker_processes ##WORKER_PROCESSES##;

error_log /dev/stdout info;
pid /var/run/nginx.pid;

events {
  worker_connections 1024;
}

http {
  access_log /dev/stdout;

  server {
    listen ##PORT##;
    server_name ##SERVER_NAME##;

    client_max_body_size ##CLIENT_MAX_BODY_SIZE##;
    proxy_read_timeout ##PROXY_READ_TIMEOUT##;

    include /etc/nginx/conf.d/*.conf;

    location / {
      proxy_pass ##PROXY_PASS##;
      auth_basic "Restricted";
      auth_basic_user_file /etc/nginx/.htpasswd;

      proxy_set_header X-Forwarded-Host $host;
      # Do not pass Authorization header to destination
      proxy_set_header Authorization "";
    }
  }

  server {
    listen 8090;

    location /nginx_status {
      stub_status on;
      access_log off;
    }
  }
}
Now, you can build and run the new docker stack:
docker compose -f docker-compose.yml build
docker compose -f docker-compose.yml up -d
The last step will be to secure prometheus-node-exporter by restricting the IP range from which data can be retrieved to the internal Docker network, by editing the file /etc/default/prometheus-node-exporter, adding:
ARGS="--web.listen-address=172.17.0.1:9100"
(this port is also secured by HTTP Basic Auth from the docker file above)
And then restarting the service:
sudo systemctl restart prometheus-node-exporter.service
Note: Don’t forget to align user and password with the prometheus targets config file that we saw before.
Conclusion
Setting up a homelab can be a rewarding experience that offers both practical benefits and opportunities for learning. By using tools like Docker, Grafana, Prometheus, and various exporters, you can effectively monitor and manage your services while gaining valuable skills that are applicable to professional development work.
In this guide, we walked through the process of creating dashboards for monitoring and discussed the importance of securing access to sensitive data, especially when extending your monitoring capabilities to external services. With these steps, you can ensure your homelab is both efficient and secure, providing a robust environment for experimentation and self-hosting.
Whether you’re just starting out with a single Raspberry Pi or expanding your setup with multiple hosts, remember that the key to a successful homelab is continuous learning and adaptation. Keep exploring new tools and techniques, and enjoy the journey of building and managing your own digital ecosystem.